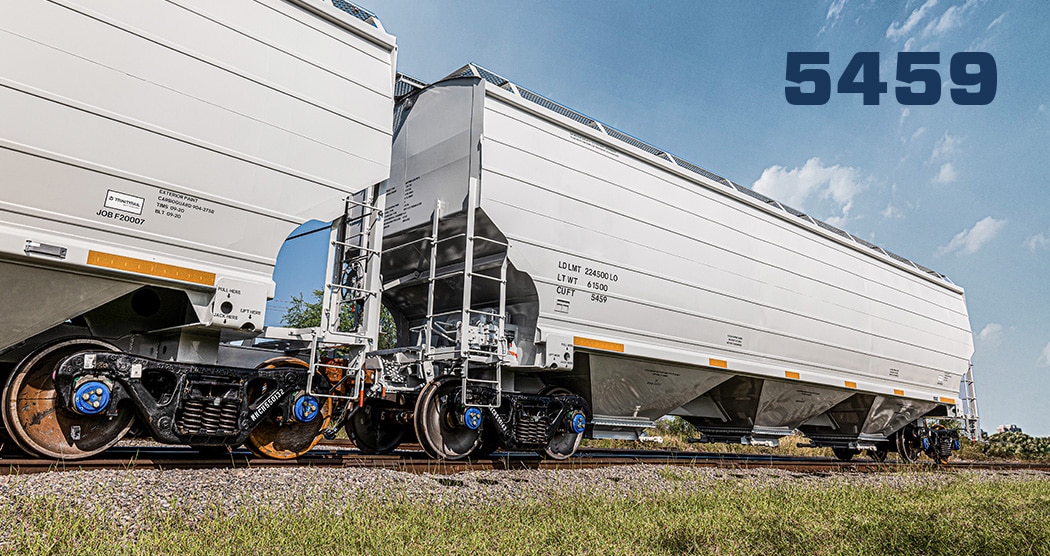
The new insulated box car is an innovative solution for the transportation of temperature-sensitive products including food and beverages.
rinity Industries, Inc. Announces Third Quarter 2021 Results
Company Release – 10/21/2021
Reports quarterly GAAP and adjusted earnings from continuing operations of $0.33 and $0.29 per diluted share, respectively
Generates year-to-date operating and total free cash flow of $428 million and $516 million, respectively
Returned $473 million of capital to stockholders year-to-date through dividends and share repurchases
DALLAS–(BUSINESS WIRE)– Trinity Industries, Inc. (NYSE:TRN) today announced earnings results for the third quarter ended September 30, 2021.
Financial and Operational Highlights
Quarterly total company revenues of $504 million
Quarterly income from continuing operations per common diluted share (“EPS”) of $0.33 and quarterly adjusted EPS of $0.29
Completed initial railcar portfolio sale of $325 million to Signal Rail Holdings LLC, a new railcar investment vehicle (“RIV”) partner
Lease fleet utilization of 95.0% and Future Lease Rate Differential (“FLRD”) of positive 1.4% at quarter end
New railcar orders of 2,530 and railcar deliveries of 2,410
Year-to-date cash flow from operations and total free cash flow after dividends and investments (“Free Cash Flow”) were $428 million and $516 million, respectively
Repurchases of approximately 2.8 million shares at a cost of $77 million
Committed liquidity of $1.1 billion as of September 30, 2021
Management Commentary
“Trinity continues to execute well on our strategy to enhance returns and shareholder value,” remarked Trinity’s Chief Executive Officer and President, Jean Savage. “The Company continued to advance toward our initiatives to improve returns, highlighted by the $325 million portfolio sale in our latest RIV partnership. The Signal Rail portfolio sale this past quarter and its resulting benefit to our earnings and balance sheet are a prime example of this dynamic.”
“While market activity continues to improve, Trinity’s third quarter results were negatively impacted by labor shortages and turnover as well as supply chain disruptions, diluting the impact of margin improvement initiatives in the Rail Products Group,” Ms. Savage continued. “It is important to note that while this quarter was challenged, we continue to expect improving demand for railcars and profitability.”
“In contrast, our Railcar Leasing and Management Services Group had another quarter of strong performance, and we maintain our view that market fundamentals for railcar leasing should continue to ramp up into 2022. The Future Lease Rate Differential climbed again in the third quarter to 1.4%, compared to negative 2.5% and negative 14.8% in the past two quarters.”
Ms. Savage concluded, “It has been nearly a year since we introduced our strategic vision, and I am pleased with the progress we have made. We are continuing to execute on our goals, and despite a challenging quarter in Rail Products, the Company’s enthusiasm to achieve the goals we set out in last year’s Investor Day presentation has never been stronger.”
Consolidated Financial Summary
Three Months Ended
September 30,
2021
2020
Year over Year – Comparison
(in millions, except percentages and per share amounts)
Revenues (1)
$
503.5
$
459.4
Increased demand and higher pricing in our highway products business and higher external deliveries in the Rail Products Group
Selling, engineering, and administrative expenses
$
54.3
$
51.2
Higher employee-related costs, including increased incentive-based compensation
Operating profit
$
92.2
$
72.9
Higher volume of railcar sales from our lease portfolio, partially offset by higher costs associated with external deliveries in the Rail Products Group, and lower lease rates and higher depreciation expense in the Leasing Group
Interest expense, net
$
45.2
$
51.7
Lower overall borrowing costs associated with the Company’s debt, partially offset by higher overall average debt
Net income from continuing operations attributable to Trinity Industries, Inc.
$
32.4
$
25.1
EBITDA (2)
$
163.6
$
136.4
Effective tax expense (benefit) rate
23.9%
(34.9)%
2020 tax benefit primarily related to tax law changes
Diluted EPS – GAAP
$
0.33
$
0.21
2021 includes $0.04 favorable impact of storm-related insurance recoveries
Diluted EPS – Adjusted (2)
$
0.29
$
0.17
Nine Months Ended
September 30,
2021
2020
Year over Year – Comparison
(in millions)
Net cash provided by operating activities – continuing operations
$
428.0
$
456.8
Free Cash Flow (2)
$
515.5
$
48.5
Higher volume of railcar sales from our lease portfolio and the timing difference of debt proceeds issued for financing lease fleet equity investment
Capital expenditures – leasing (3)
$
363.9
$
448.8
Returns of capital to stockholders
$
473.2
$
193.1
Increase in share repurchase activity in 2021, which included a privately negotiated repurchase agreement totaling $222.5 million in the second quarter
(1) Beginning in the fourth quarter of 2020, we made a prospective change to the presentation of railcar sales and now present all sales of railcars from the lease fleet as a net gain or loss from the disposal of a long-term asset regardless of the age of railcar that is sold. Historically, we presented sales of railcars from the lease fleet on a gross basis in leasing revenues and cost of revenues if the railcars had been owned for one year or less at the time of sale. Sales of railcars from the lease fleet owned for more than one year had historically been presented as a net gain or loss from the disposal of a long-term asset.
(2) Non-GAAP financial measure. See the Reconciliations of Non-GAAP Measures section within this Press Release for a reconciliation to the most directly comparable GAAP measure and why management believes this measure is useful to management and investors.
(3) For the nine months ended September 30, 2020, Capital expenditures – leasing is net of sold lease fleet railcars owned one year or less.
Business Group Summary
Three Months Ended
September 30,
2021
2020
Year over Year – Comparison
(in millions, except percentages and number of units)
Railcar Leasing and Management Services Group
Leasing and management revenues
$
185.5
$
183.9
Growth in the lease fleet, slightly higher utilization, and increased servicer fees, partially offset by lower rental rates
Leasing and management operating profit
$
76.4
$
86.8
Increased depreciation, higher fleet operating costs, and lower lease rates, partially offset by slightly higher fleet utilization
Operating profit on lease portfolio sales
$
32.9
$
2.9
Higher volume of railcars sold from the lease portfolio
Fleet utilization
95.0%
94.8%
Future Lease Rate Differential (“FLRD”) (1)
+1.4%
(20.9)%
Recovery of current market lease rates compared to the prior year period
Owned lease fleet (in units) (2)
105,915
105,925
Initial sale to new RIV partner, partially offset by growth in the lease fleet
Investor-owned lease fleet
(in units)
30,060
26,655
Initial sale to new RIV partner
Rail Products Group
Revenues
$
339.9
$
381.2
Lower deliveries and a shift in the mix of railcar products and services sold
Operating profit (loss) margin
(0.9)%
0.8%
Lower deliveries, mix changes, higher input costs and supply chain disruptions, along with operating inefficiencies, such as labor shortages and turnover, in our maintenance services business
New railcars:
Deliveries (in units)
2,410
2,605
Orders (in units)
2,530
2,000
Order value
$
218.6
$
186.8
Higher number of units and differences in product mix
Backlog value
$
1,228.4
$
1,155.4
Sustainable railcar conversions:
Deliveries (in units)
242
—
Backlog (in units)
1,127
—
Backlog value
$
98.3
$
—
All Other
Revenues
$
83.7
$
62.6
Increased demand and higher pricing for highway products
Operating profit
$
14.7
$
7.3
Increased demand and manufacturing efficiencies in our highway products business and a gain on the disposition of a non-operating facility
September 30, 2021
December 31, 2020
Loan-to-value ratio
Wholly-owned subsidiaries, including corporate revolving credit facility
63.4%
58.5%
Increased leverage associated with leased assets, partially offset by amortization of debt on encumbered assets
(1) FLRD calculates the weighted average of the most current quarterly lease rates transacted compared to the weighted average lease rates for railcars expiring over the next twelve months.
(2) Includes wholly-owned railcars, partially-owned railcars, and railcars under sale-leaseback arrangements.
Additional Business Items
Liquidity and Capital Resource Updates
In August 2021, Trinity and Wafra, Inc. (“Wafra”), a global alternative investment manager, announced a new RIV program between Trinity and certain funds managed by Wafra (“Wafra Funds”). The joint venture created as part of this program, known as Signal Rail Holdings LLC (“Signal Rail”), is owned 90% by Wafra Funds and 10% by our wholly-owned subsidiary, Trinity Industries Leasing Company (“TILC”). Signal Rail or its subsidiaries are expected to invest in diversified portfolios of leased railcars originated by TILC targeting up to $1 billion in total acquisitions over an expected three-year investment period. TILC will service all railcars owned by Signal Rail.
In connection with the launch of the RIV program, in August 2021, TILC sold to Signal Rail an initial portfolio of 3,582 railcars and related leases that were previously owned by TILC and its subsidiaries for an aggregate sales price of approximately $325 million. As a result of the sale, TILC received approximately $319 million in cash and a 10% equity interest in Signal Rail valued at $6 million. TILC recognized a gain of approximately $33 million on the initial portfolio sale during the three months ended September 30, 2021.

